flation
What's your money
really worth?
What was $1,000 in 2021 worth today? What would that 1990 rent cost now? Is your raise keeping up with prices in your region? flation answers with the U.S. Consumer Price Index, month by month, straight from the U.S. Bureau of Labor Statistics.
For iPhone, iPad, and Mac. Requires iOS 18, iPadOS 18, or macOS 15 or later.
Inspiration
A calculator is one point in time.
I'm of the age where I constantly notice that things cost a lot more today than they did when I was a kid. The BLS CPI Inflation Calculator is nice and all, but it's only a single point in time. I wanted an app that calculates an arbitrary value in terms of point-in-time purchasing power and real value, and shows those calculations over time. (More on that.)
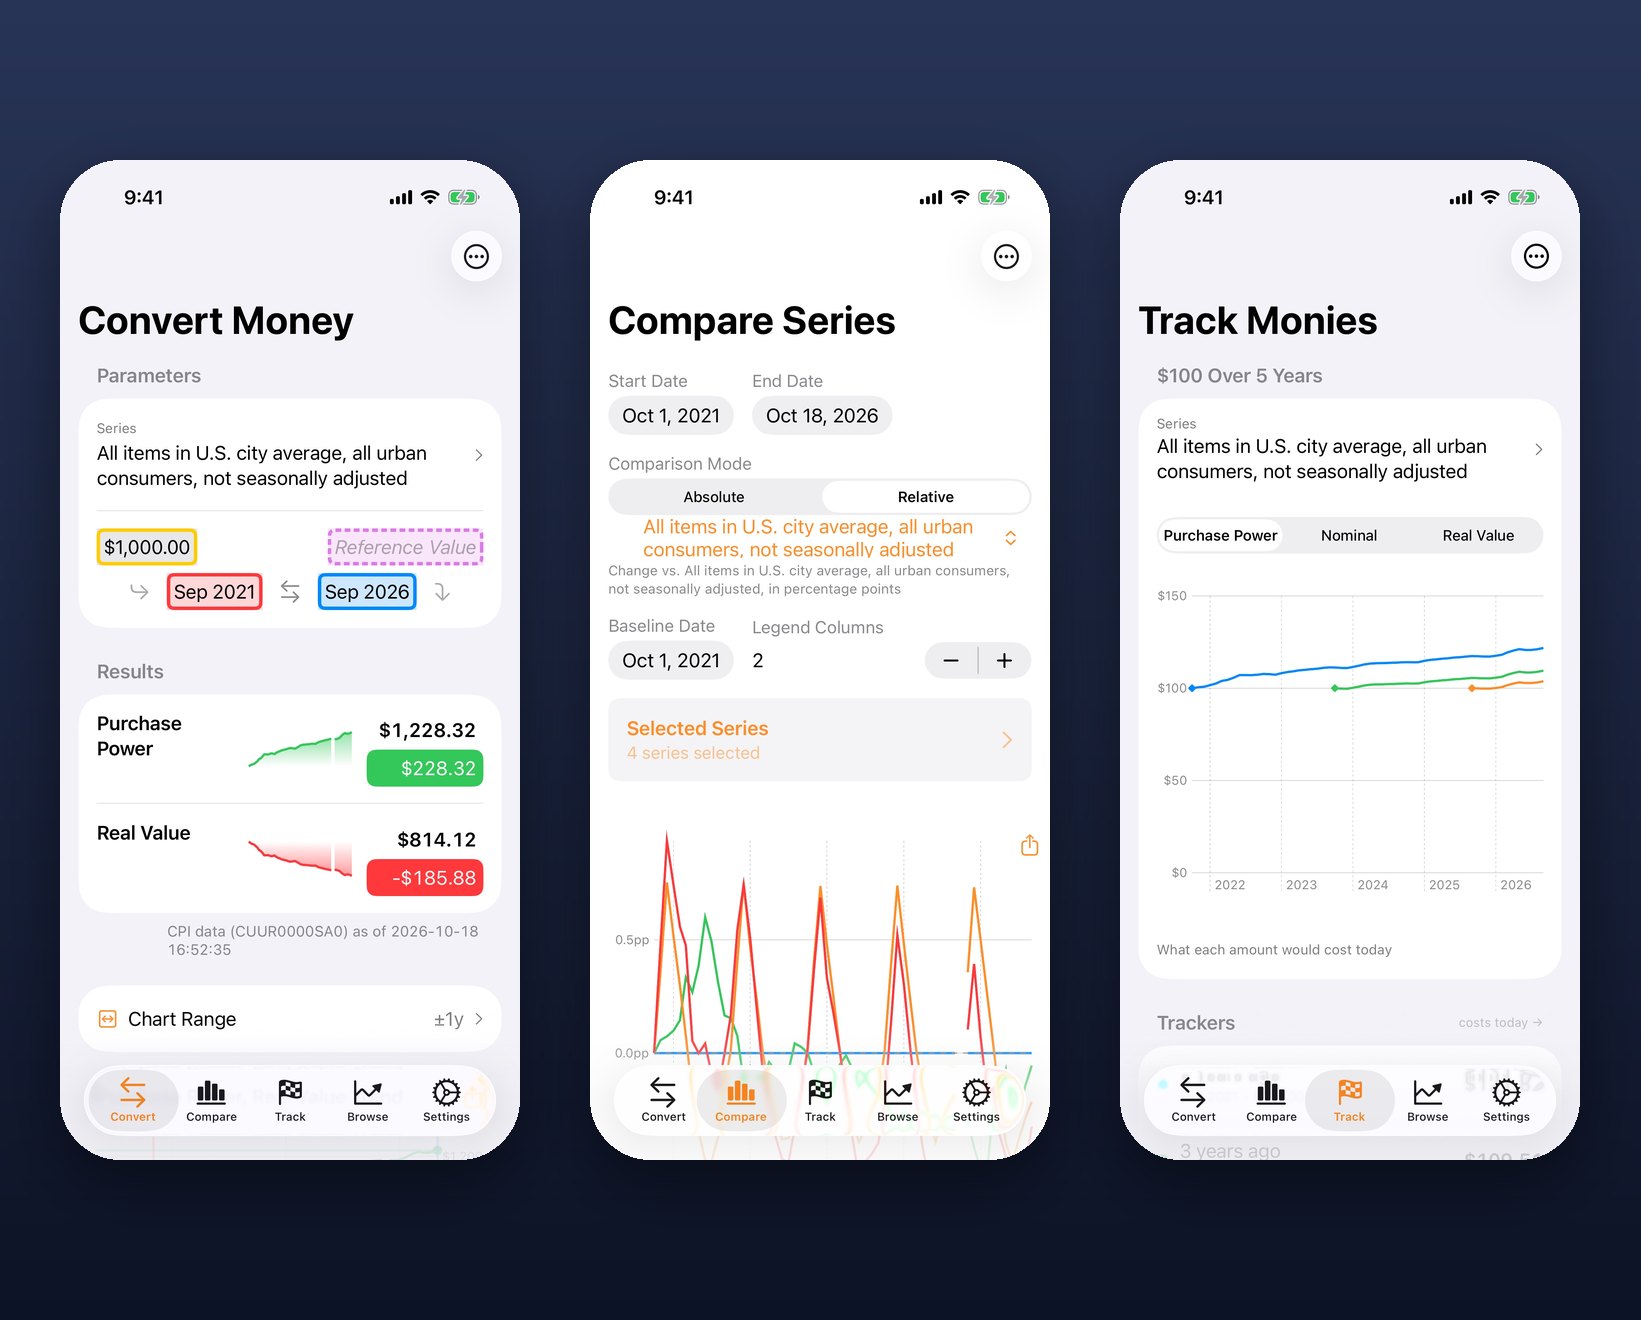
This version is a ground-up rewrite. The data is downloaded directly from BLS, so flation is no longer limited to a single series, and alongside the converter there are three new tools: Compare Series, Track Monies, and Browse Series.
Convert Money
Two dates. Two answers.
Enter an amount and two months, and flation shows the result two ways. In the example below, $1,000 from September 2021 is compared with September 2026.
$1,228.32
Purchase Power
What the amount at the first date would cost at the second date.
$814.12
Real Value
What the amount at the first date is worth in the second date's dollars.
Infl · Defl
Cumulative inflation
The total change in prices between the dates; on Real Value, the purchasing power lost or gained (Loss · Gain).
CAGR · SAR · LOG
Annualized
Tap a result's capsule to cycle through the dollar change, cumulative inflation, compound annual growth rate, simple annualized return, and logarithmic return.
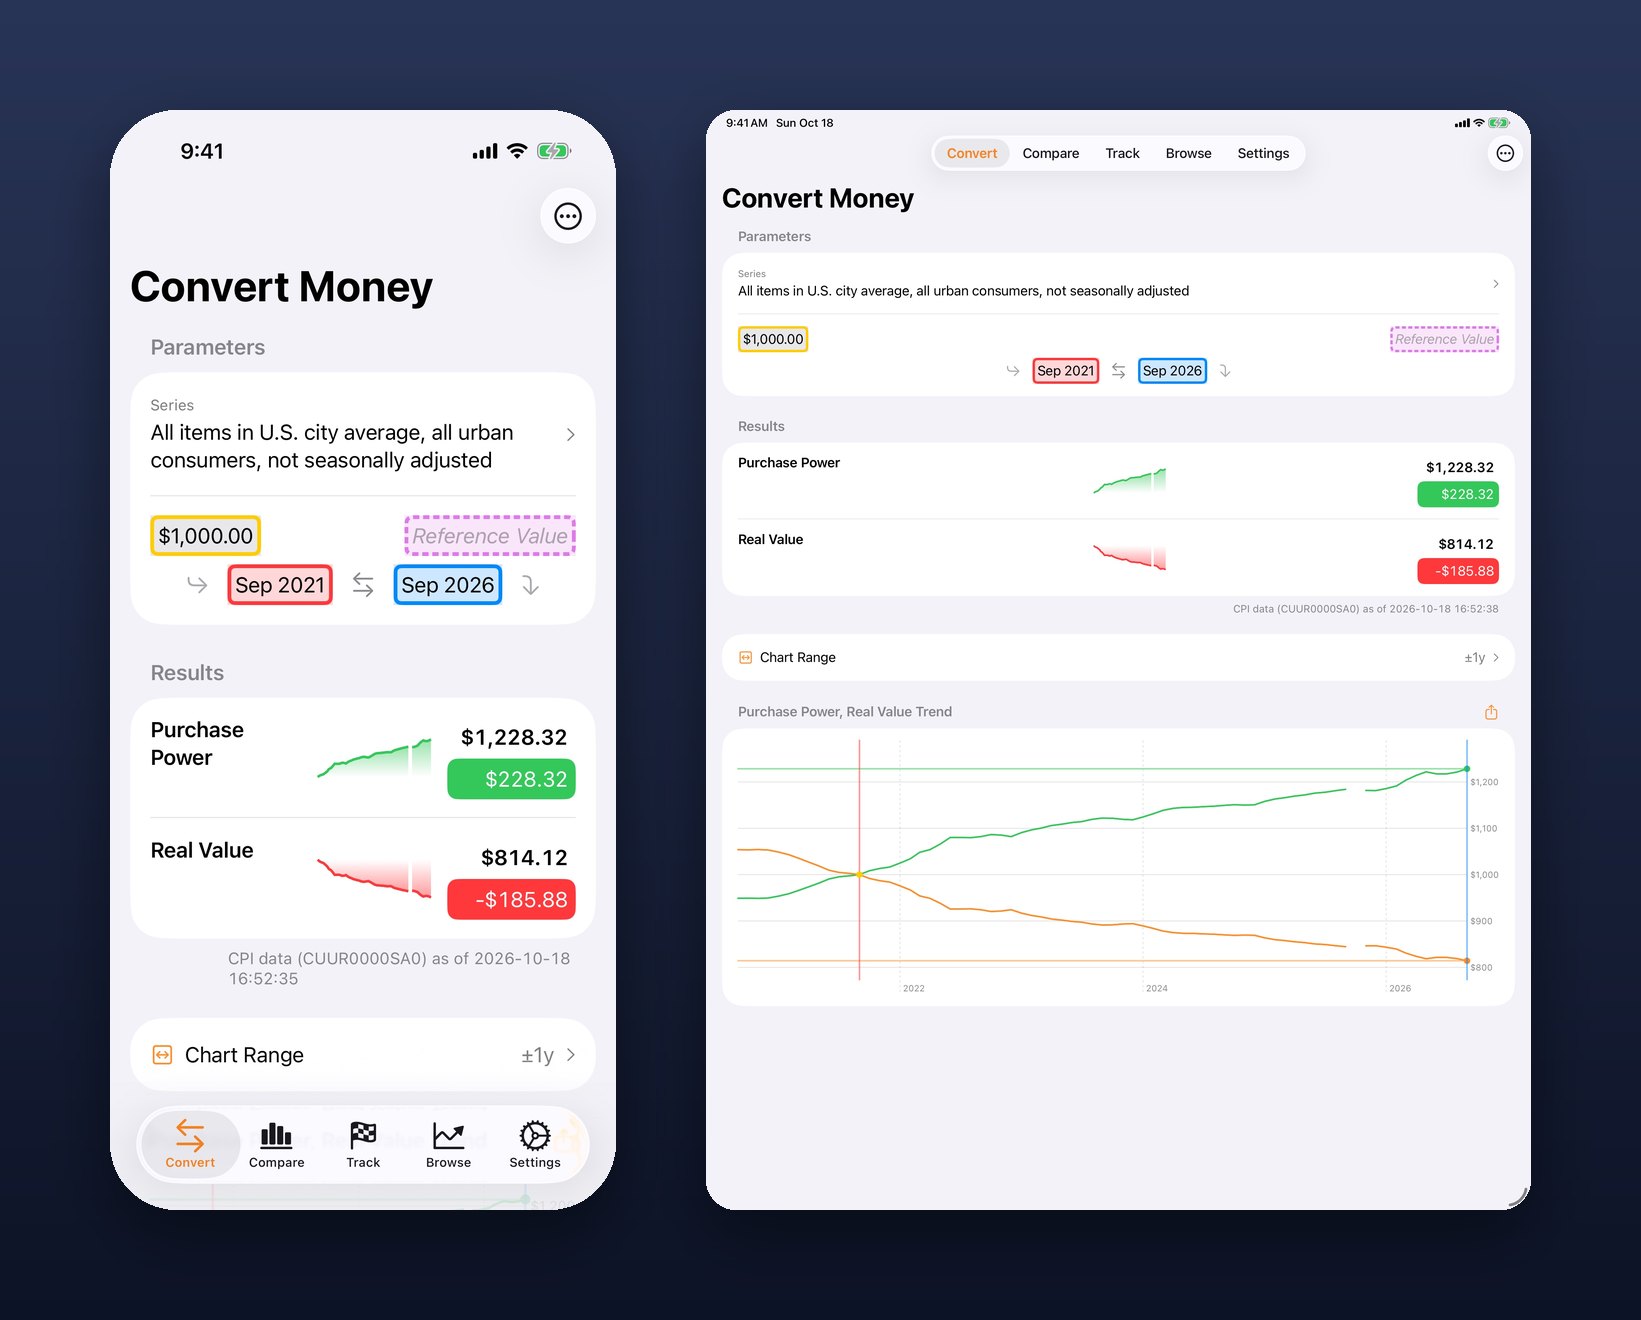
Charts. Purchase Power and Real Value trends, and inflation change vs. the prior year and vs. the prior period as a trend or a scatterplot. With Pro, recessions can be shaded using business cycle dates from the National Bureau of Economic Research.
Chart Range. Choose how much history surrounds your two dates, from a month either side up to the entire series. On iPhone, rotate the device for larger charts you can interact with. Any chart can be shared as a PNG image.
Save it. Any conversion can be saved. A saved conversion can end at the latest data, so it stays current as new CPI months are released; a Rolling Window moves the start date too, so "the last five years" stays the last five years.
Compare Series
Prices don't all rise together.
Pick two or more series and chart them over the same dates: housing against medical care against energy, or your region against the national average. Maybe you want to replicate the Chart of the Century?
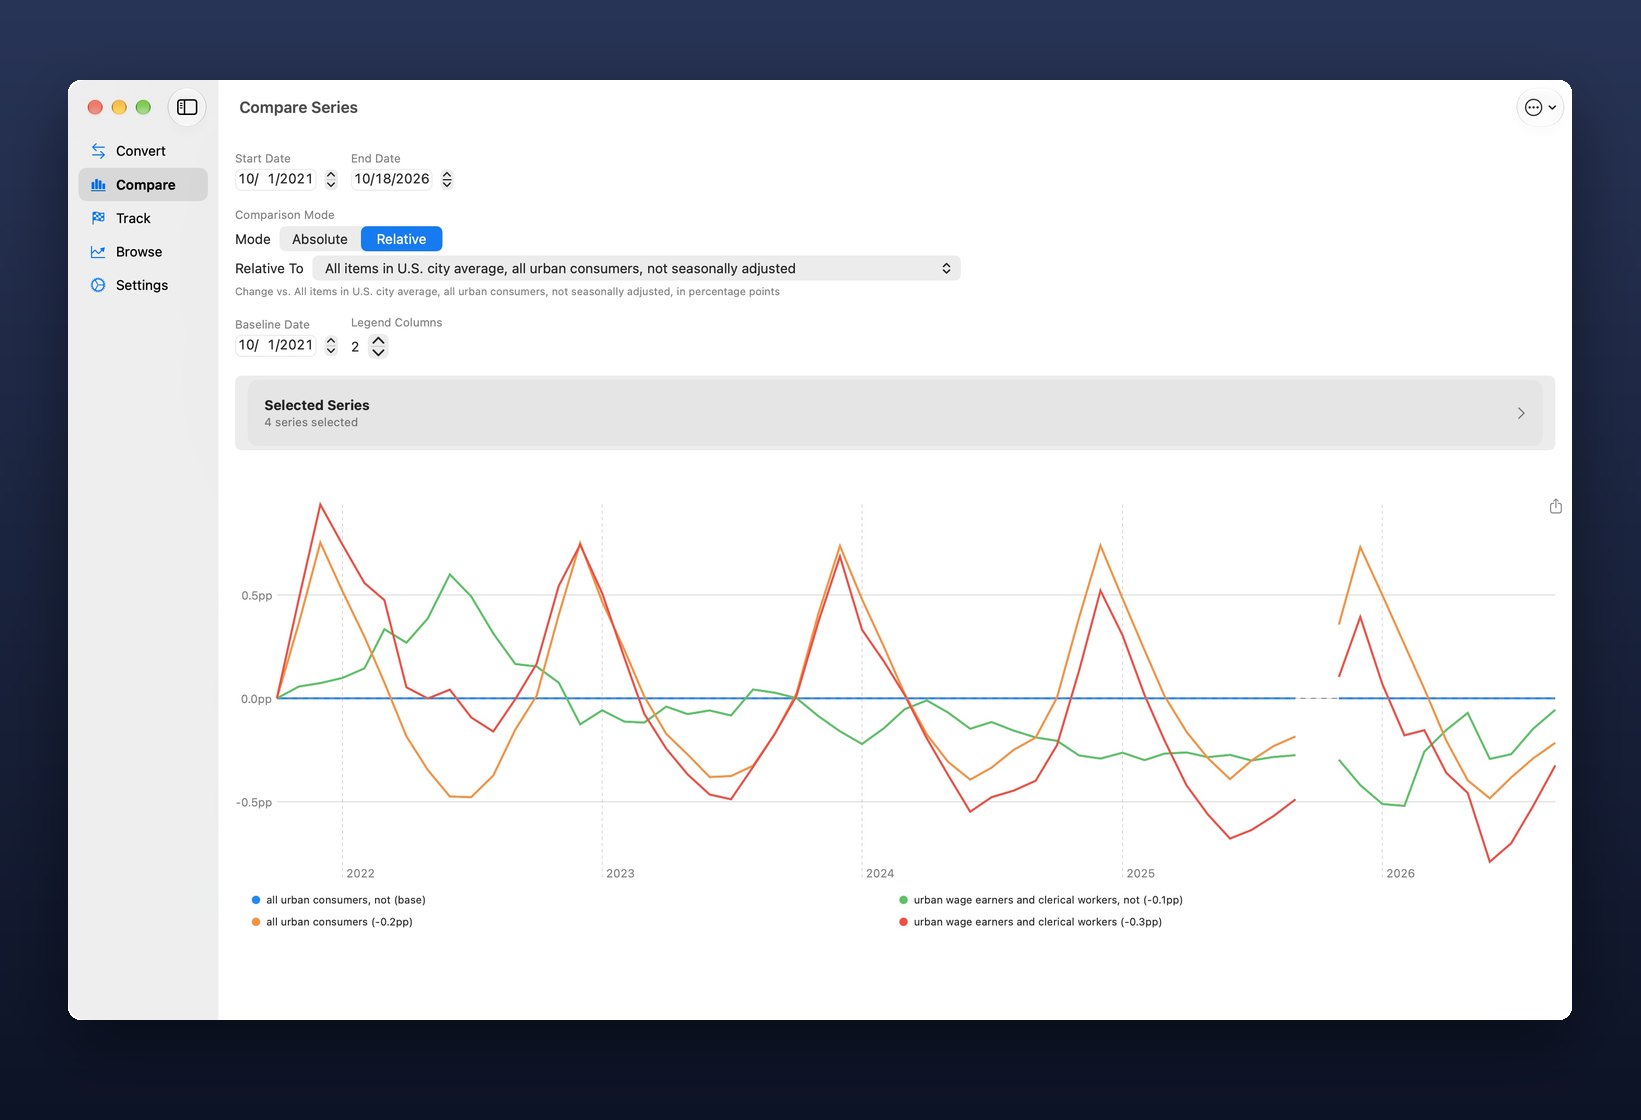
Absolute. Each series' change from a baseline date, with an optional line for the average of the selected series.
Relative. Each series against one of them, or against their average, in percentage points.
Yours to adjust. Set the start, end, and baseline dates and the number of legend columns. Save comparisons, including with a rolling window, and share the chart as an image.
Track Monies
Did that raise keep up?
A tracker follows an amount that changes over time, like a salary, rent, or tuition. Each entry starts a new value at its date, and an optional final date ends the tracker. Group trackers into a set charted against one series.
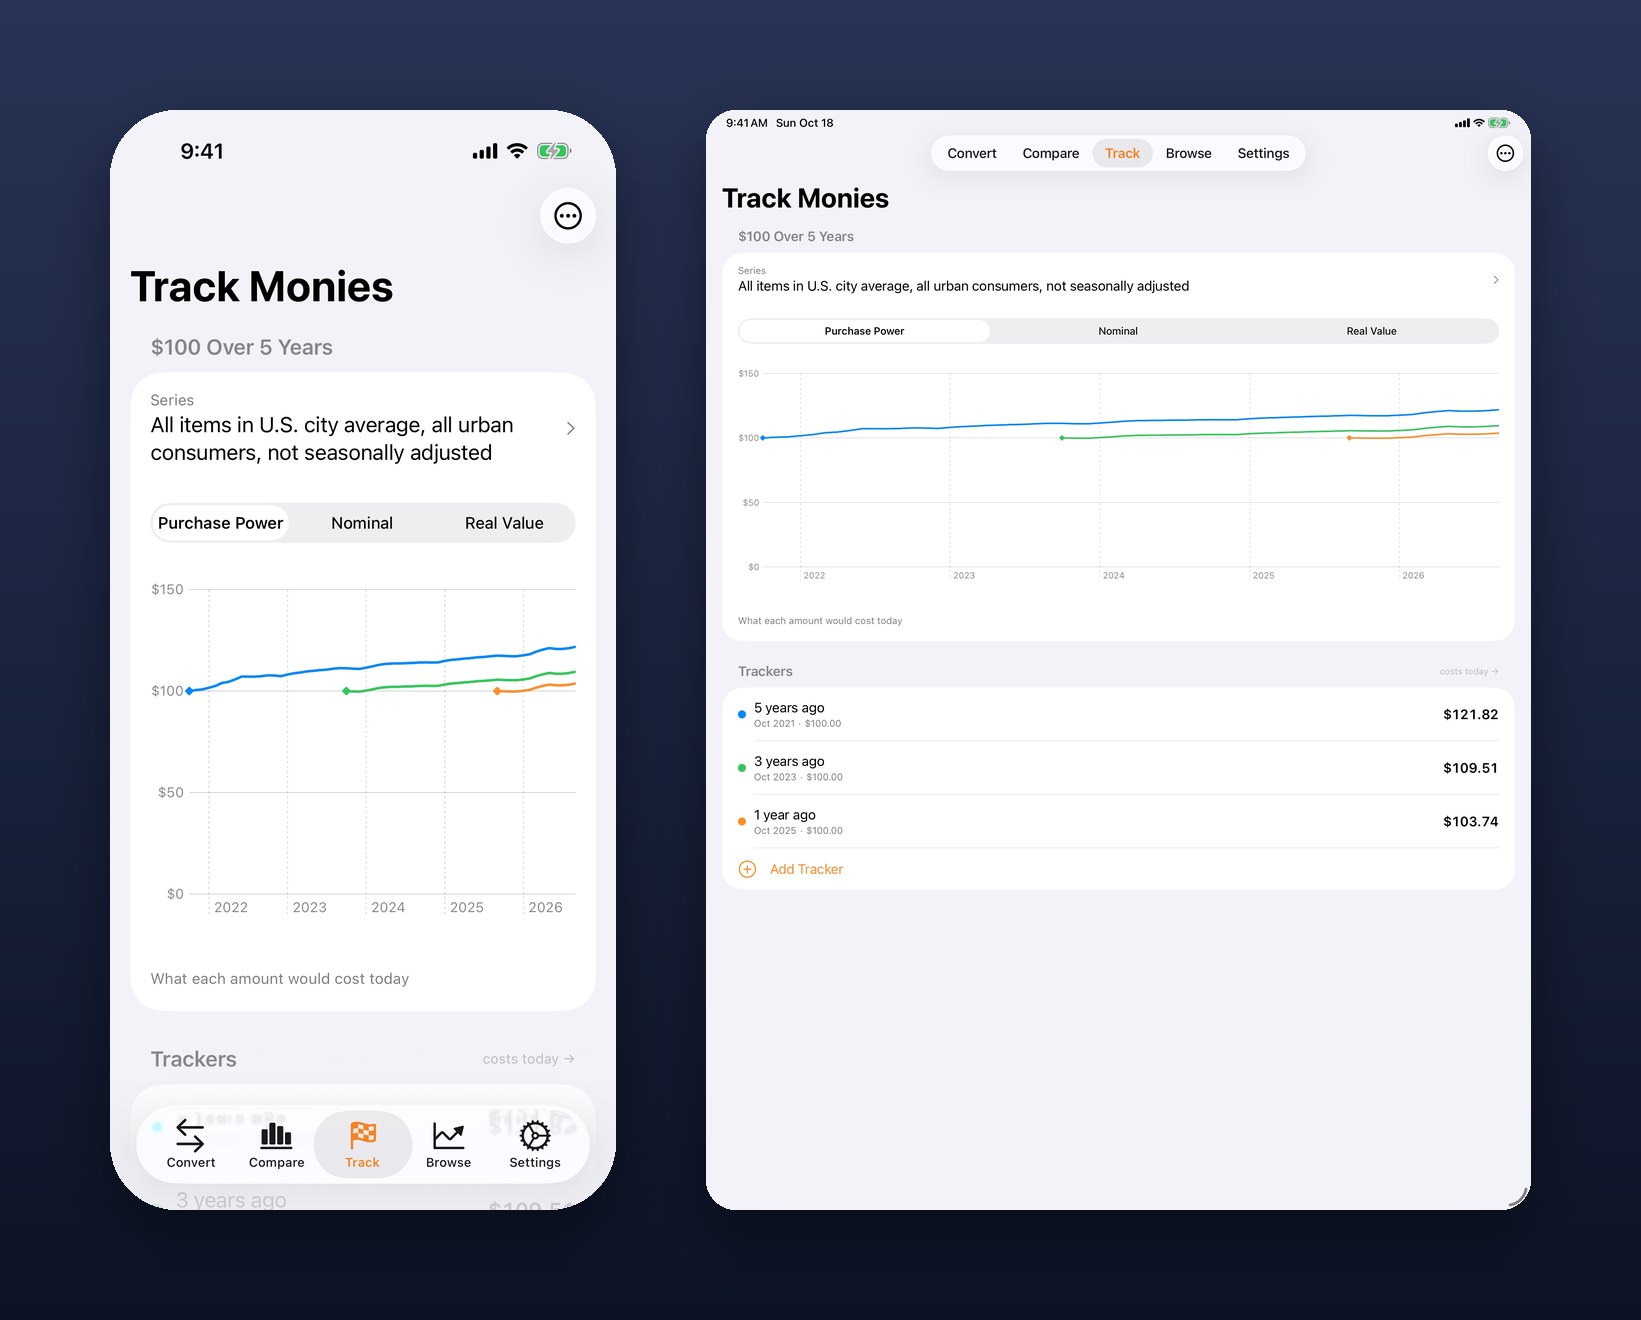
Purchase Power
What each amount would cost today.
Nominal
Each amount at face value, not adjusted for inflation.
Real Value
What each amount's buying power has eroded to.
Bring your numbers. Export tracker sets to CSV, one set or all of them at once. With Pro, import them from CSV, too.
Browse Series
Over 12,000 active series.
Search every downloaded series by name or series ID, filter by population, seasonal adjustment, period, area, and item, and see each one's latest year-over-year change or CPI value at a glance.
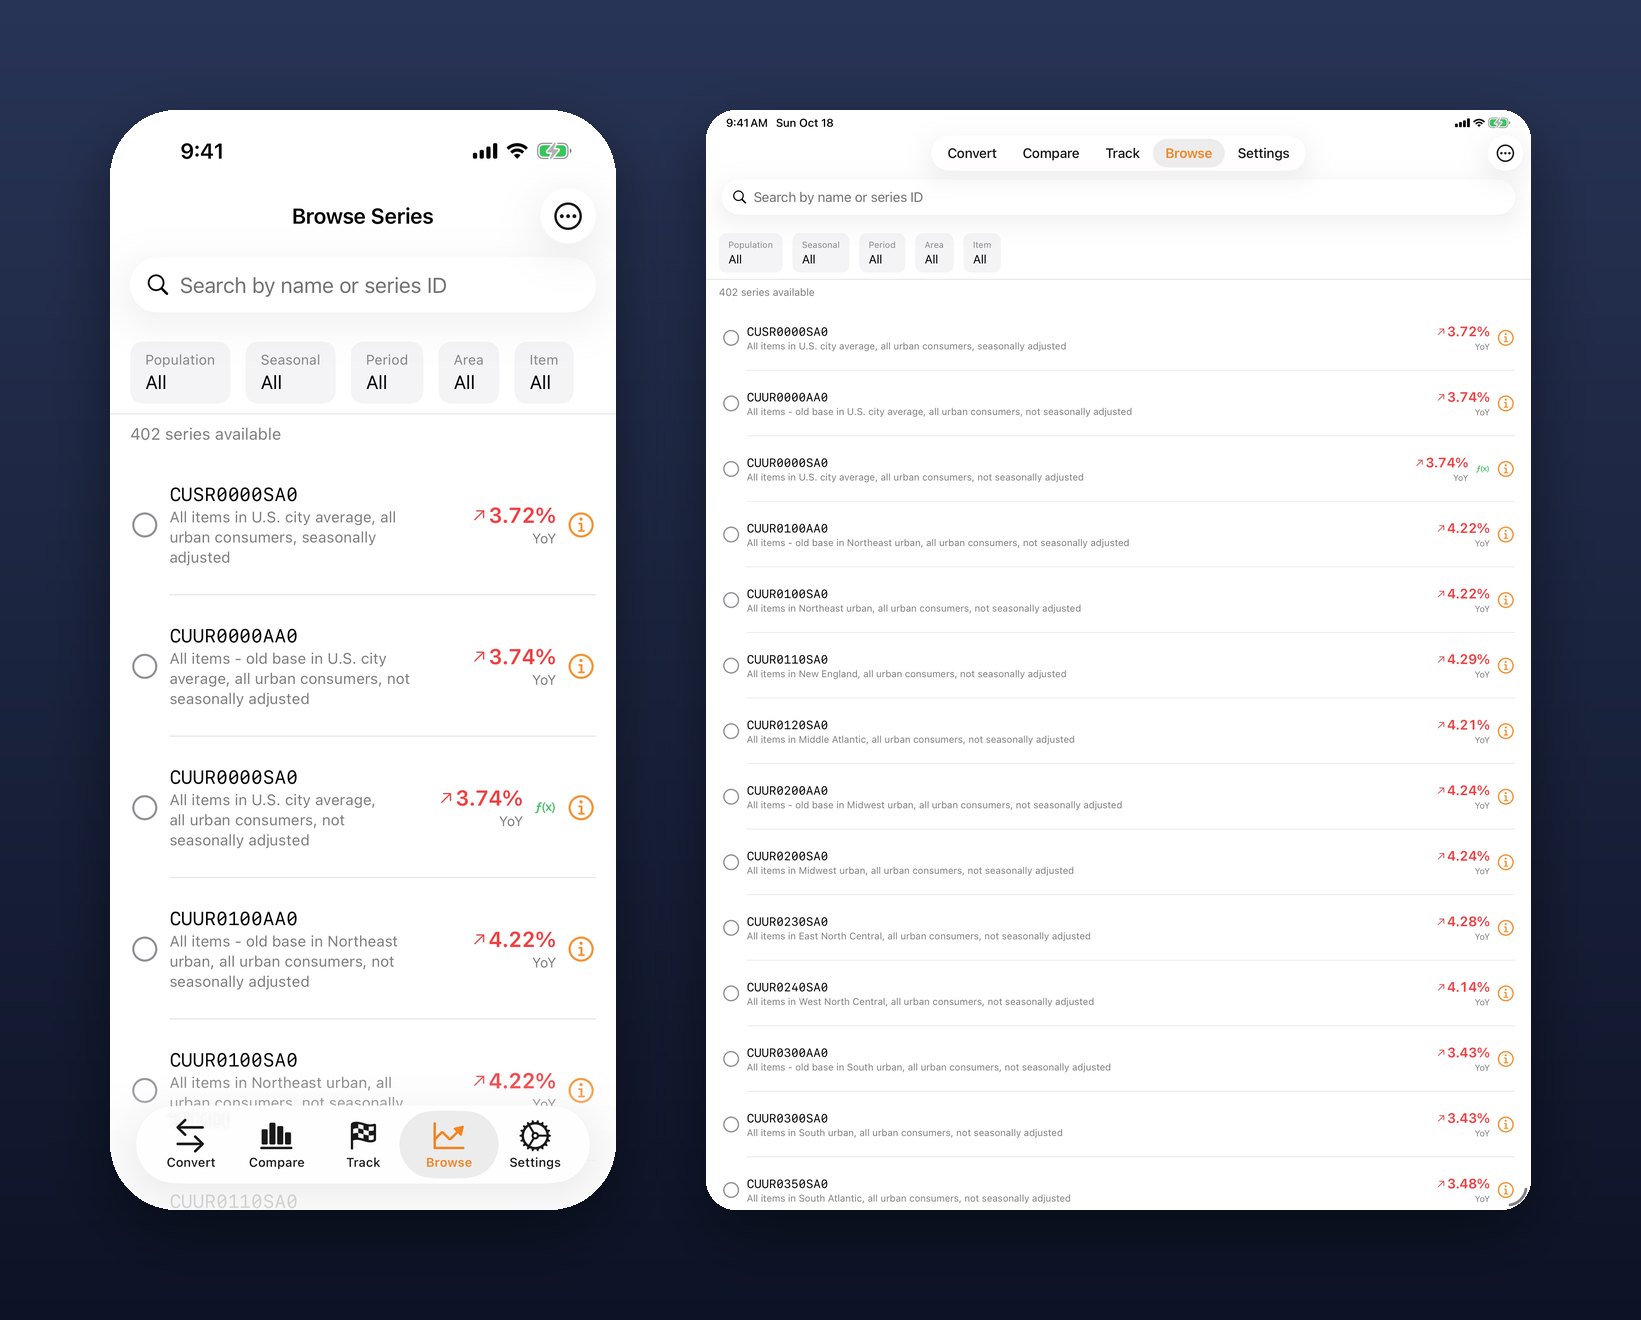
Favorites. Favorite the series you use most; favorites sync through iCloud and survive a reinstall.
Details. With Pro, each series has a detail page with its latest value, its historical trend, a year-over-year change chart, its category, geography, date range, and frequency, and a link to the series on FRED.
The Data
Straight from BLS.
flation downloads CPI data directly from the U.S. Bureau of Labor Statistics. New figures are usually published between the 10th and 15th of each month for the prior month (schedule). On iPhone and iPad, pull down to refresh.
Basic Data
The All items series for every area, for both CPI populations: all urban consumers (CPI-U) and urban wage earners and clerical workers (CPI-W).
Regional (Pro)
Northeast, North Central, South, and West, each split into metro and other areas.
Categories (Pro)
Food & Beverages, Housing, Apparel, Transportation, Medical Care, Recreation, Education & Communication, Other Goods & Services, Population Data, and Commodities & Services.
Pick what you need. Together the subsets cover 21 metro areas plus urban Alaska and Hawaii, and nearly 400 item categories. Settings › Data Subsets shows the approximate series count and download size before you download.
On the Mac
Room for wide charts.
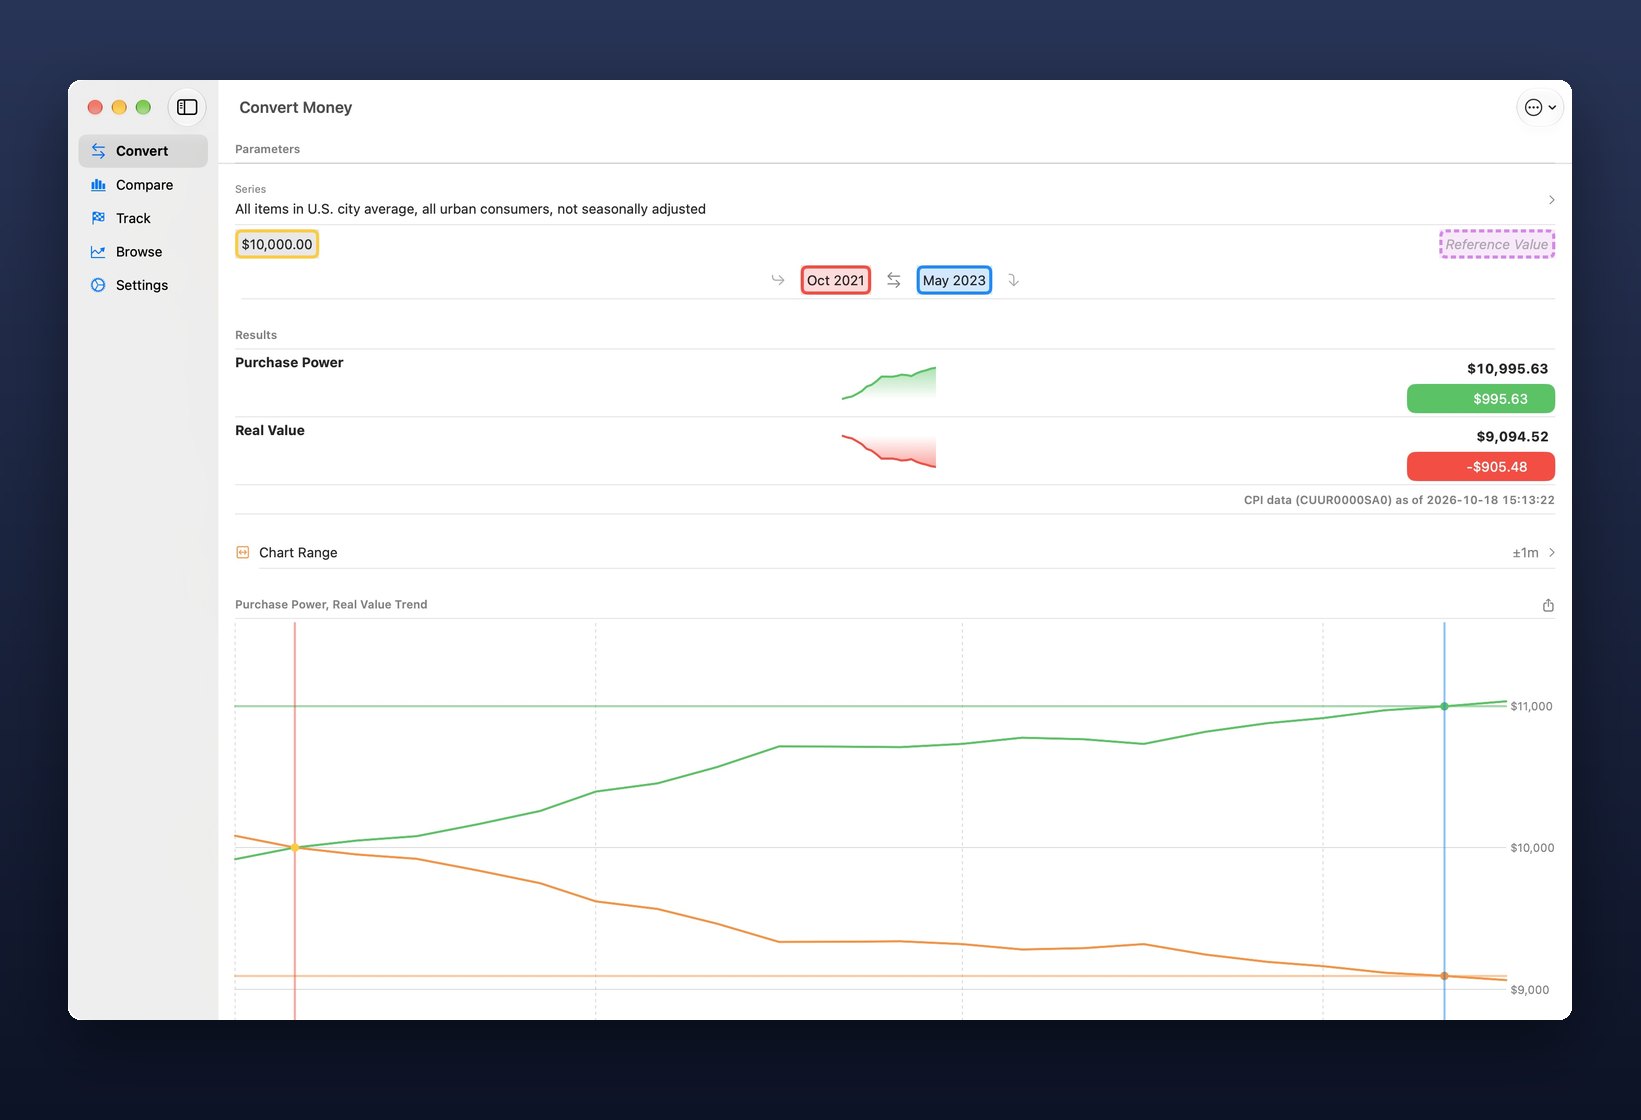
On the Mac, flation is a native app with a sidebar for Convert, Compare, Track, Browse, and Settings.
flation Pro
Free to start.
Pro for everything.
Everything Pro offers is shown to free users, so you can see what's there before you subscribe.
Free
- The four "All items, U.S. city average" series: CUUR0000SA0 and CUSR0000SA0 (all urban consumers, not seasonally adjusted and seasonally adjusted), and CWUR0000SA0 and CWSR0000SA0 (urban wage earners, likewise).
- Their last five years of history.
- One ready-made example each of a conversion, a comparison, and a tracker set.
Pro
A yearly subscription that unlocks:
- every series and its full history (CUUR0000SA0 goes back to 1913)
- the regional and category data subsets
- series details
- recession shading
Already a customer?
If you purchased the previous version of flation (paid upfront), you get Pro for life at no additional charge.
New device or reinstalled? Open Settings › Subscription Status, then tap Restore Subscription or Prior Paid App Purchase.
Privacy
Data Collection
flation does not collect any data.
Downloads
To work, the app downloads public files: CPI data from the U.S. Bureau of Labor Statistics, business cycle dates from the National Bureau of Economic Research, and the in-app messages feed from this website. Those servers receive an ordinary web request, as they would from a browser; nothing about you or your use of the app is sent.
iCloud
Your favorite series are stored in your own iCloud account so they follow you between devices. Everything else stays on your device.
Data Sharing
Given the above points, flation cannot share data. flation is a SwiftUI app built on Apple's frameworks, with no third-party libraries.
Data Retention
Since flation does not collect data, flation cannot retain data.
Support
There's not much that can go wrong with flation. That said, if after restarting your device and reproducing the issue you think you've found a bug, please reach out; I don't like bugs either.
Terms
Feel free to use flation at your leisure for whatever purpose you have in mind. Here's Apple's standard EULA.
Subscription
flation Pro is an auto-renewing yearly subscription, billed to your Apple Account. It renews automatically unless canceled at least 24 hours before the end of the current period; manage or cancel it in your App Store account settings.
Refunds
All flation purchases are final. I cannot issue refunds for charges to your Apple Account, but you can ask Apple to do so.
For Reference Only
flation is not intended for, and should not be used for future-looking purchase power or real value.