(In|De)flation
Tuesday, 12 March, 2024
⨳ 3 minute read ⨳ 620 words ⨳ SwiftUI ⨳ api ⨳ app ⨳ iOS ⨳ iPad ⨳TLDR; I released another app.
I’m of the age where I constantly notice that things cost a lot more today than they did when I was a kid (Jun 1986). I recall riding my bike down the street to the local gas station:
- a gallon of gas was $0.859 (purchase power of about $2.44 in Feb 2024).
- a full-sized Whatchamacallit candybar was half a dollar ($1.42).
- one of the three soda machines serving 12 ounce cans of Mello Yello was set to only 35 cents ($0.99).
The purchasing power of a dollar from my youth, in today’s terms, has almost tripled (about 283% higher). Alternatively, if I had put that dollar in a mason jar and buried it, it’d have about a third of the purchasing power today; it’s still worth a dollar, but relative to the burial, its real value has decreased to only 35 cents.
I occasionally hit up the U.S. Bureau of Labor Statistics (BLS) for the CPI Inflation Calculator to compare today’s purchasing power of, for example, the price of a new vehicle from 15 years ago, or the starting salary from my prior jobs. The CPI calculator is nice and all, but it’s only a single point in time.
I thought it’d be fun to build an app and play with different visualization options.
The underlying data is the Consumer Price Index for All Urban Consumers (CPI-U; series CUUR0000SA0) is currently sourced via BLS API (v2) calls.
The basic idea for inflation adjustment is take some monetary value at a given point in time and adjust it to a different point in time. The Federal Reserve Economic Data uses these data.
Purchase Power reflects the purchase power of the original amount as of the second date. For most of US history over the past century, the purchasing power increases over time.
Real Value reflects the real value of the original amount as of the second date. During recessions and depressions, real values can briefly decrease.
These are calculated by taking the ratio of CPI values at the two different points in time, and multiplying by the monetary value associated with one of those points in time.
Purchase Power is calculated as:
\[power = \frac{cpi_{time1}}{cpi_{time2}} * amount_{time2}\]Real Value is calculated as:
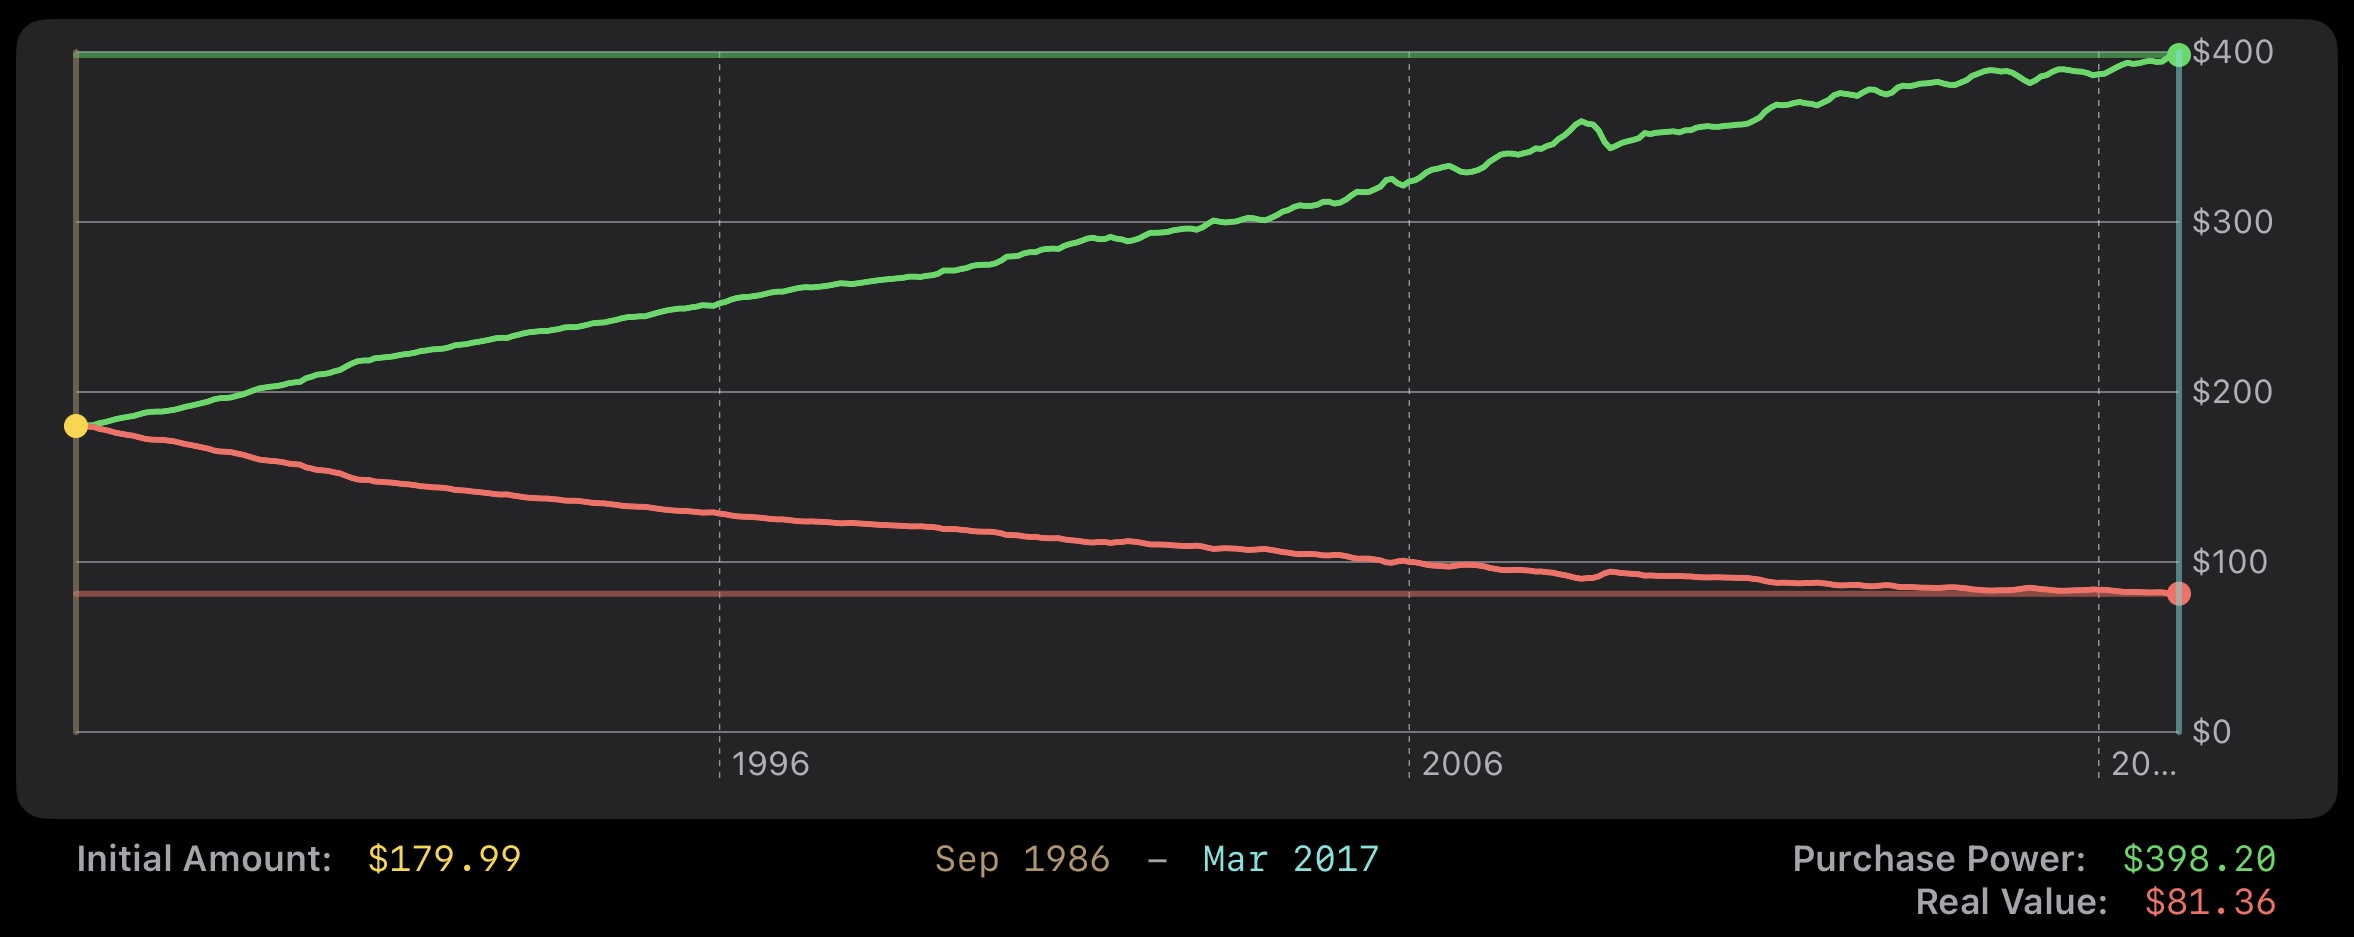
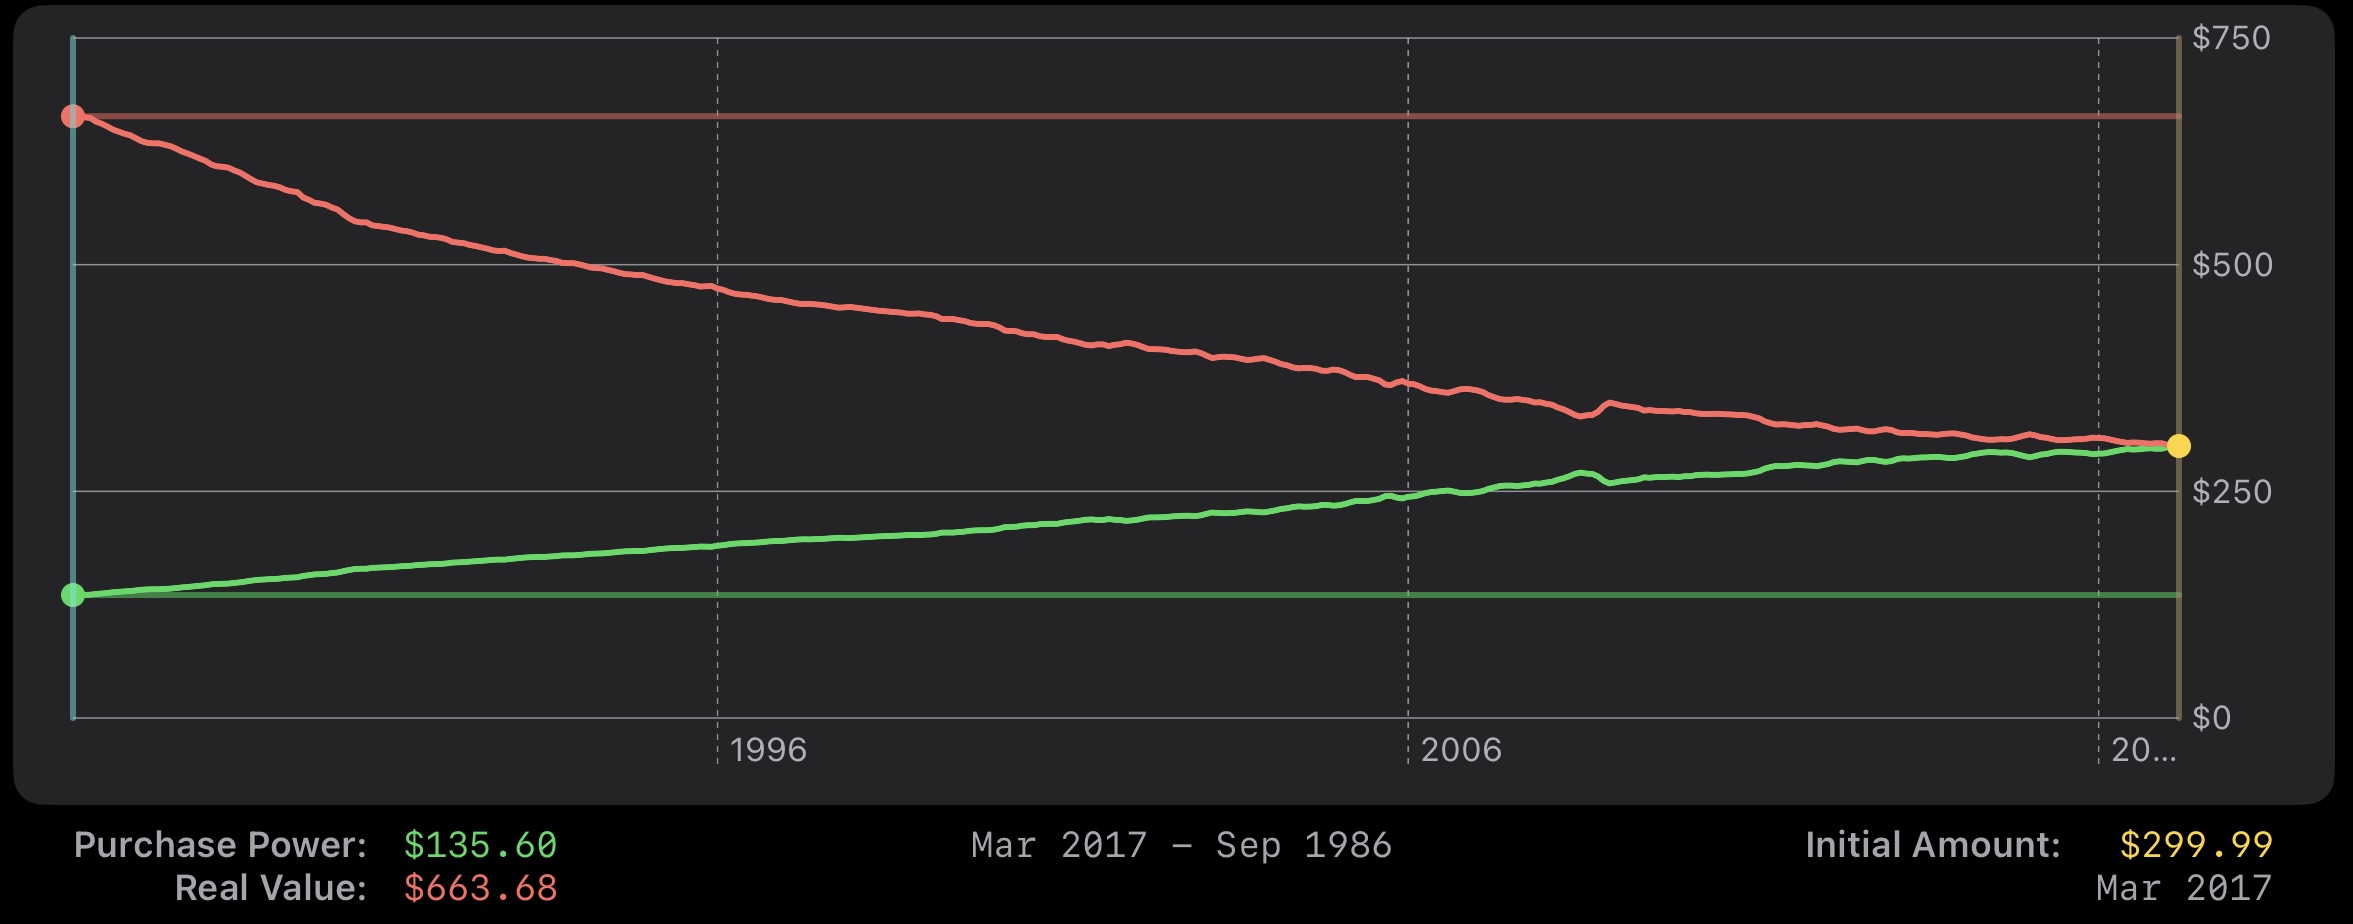
\[value = \frac{cpi_{time2}}{cpi_{time1}} * amount_{time2}\]Let’s look at an example. The original Nintendo Entertainment System (NES) sold for $179.99 when released in Sep 1986 when CPI was at 110.2. The original Nintendo Switch sold for $299.99 when released in Mar 2017 when CPI was at 243.801.
Here’s our variables:
- cpines = 110.2
- amountnes = $179.99
- cpiswitch = 243.801
- amountswitch = $299.99
- cpitoday = 310.326
Using the above formulas and variables, we arrive at the following table.
| comparison | purchase power |
real value |
|---|---|---|
| nes (sep 1986) $179.99 | ||
| as of switch | $398.20 | $81.36 |
| as of feb 2024 | $506.85 | $63.92 |
| switch (mar 2017) $299.99 | ||
| as of nes | $135.60 | $663.68 |
| as of feb 2024 | $235.68 | $381.85 |
That is to say, if the NES were released when the Switch was, it would have sold for $398.20. If the Switch were released when the NES was, it would have sold for $135.60.
How might this look?