Encoding Data Points for Use With Google Charts API Calls
Monday, 1 June, 2009
⨳ 1 minute read ⨳ 182 words ⨳ api ⨳ data visualization ⨳ quatch ⨳ sas ⨳first step, build encoding tables based on the documentation:
data encSimple encEnhanced;
    s='ABCDEFGHIJKLMNOPQRSTUVWXYZabcdefghijklmnopqrstuvwxyz0123456789-.';
    format raw 8. enc $8.;
    raw=.;
    enc='_'; output encSimple;
    enc='__'; output encEnhanced;
    do i=0 to 63;
        raw=i;
        enc=substr(s, i+1, 1);
        output encSimple;
        do j = 0 to 63;
            raw=i*(64**1)+j;
            enc=cats(substr(s, i+1, 1), substr(s, j+1, 1));
            output encEnhanced;
        end;
    end;
    drop i j s;
run;
next, encode the data:
proc summary data=sashelp.air nway;
    class date;
    format date yyq8.;
    var air;
    output out=air sum=;
run;
data test2;
    set air;
    enc=' ';
    if _n_=1 then do;
        declare hash s(dataset:'encenhanced');
        s.defineKey('raw');
        s.defineData('enc');
        s.defineDone();
    end;
    xEnc=enc;
    raw=air;
    rc=s.find();
    if rc then enc='_';
    yEnc=enc;
    drop enc raw rc;
run;
proc sql noprint;
    select xEnc, yEnc
    into :x separated by '', :y separated by ''
    from test2;
quit;
filename clip clipbrd;
data _null_;
    file clip;
    format url $1000.;
    url=catx('&'
    ,"cht=lc"
    ,"chs=250x100"
    ,"chd=s:&Y."
    ,"chco=FF000099,0000FF66"
    );
    url=catx('?', "http://chart.apis.google.com/chart", url);
    put url;
run;
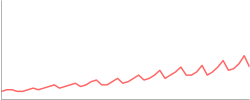
fire up your browser and paste the URL that was copied to your clipboard, and you get this:
